Abasy Atlas has a hierarchical structure enabling users to browse through the available regulatory network models, their modules (systems) and system-level elements. In every section of Abasy Atlas, a top menu bar displays five options and a search interface. The options are Homepage, Browse, Downloads, About, and Contact. Homepage is a shortcut to the homepage. Browse enables the user to explore through the atlas. Download displays an interface to download data as flatfiles. About provides background information on the atlas and the NDA. Finally, Contact provides a form for feedback from users. The Browse option and the search interface provide the two main ways to start exploring data contained in Abasy Atlas. They will be discussed in the following sections along with graphical browsing of regulatory network models.
Abasy Atlas is cross-linked to various external databases and sites providing biological, genomic, and molecular details. When a user visits an external database or site this opens in a new browser tab, whereas hyperlinks redirecting to other sections in Abasy Atlas open in the same tab.
Browsing Abasy Atlas
The Browse option is the entry point for browsing the whole atlas. This redirects to a section listing all the regulatory network models contained in the atlas. Each regulatory network model lists version, genome size and regulatory network genomic coverage, network completeness, PubMed IDs of the data sources, number and percentage of global regulators, modular genes, intermodular genes, and basal machinery genes, number of modules and a link to a separated section listing the global properties of the regulatory network model. From here, the user can list all the genes in the regulatory network model, retrieve a list of all the genes in a given class, or list all the identified modules.
In the list of genes, genes are listed along with their product description and the predicted class of system-level element (the latter only applicable for all and modular genes). Each gene name is canonical (see Construction and content section in our paper) and links to a gene details section showing identity (locus tag, UniProt ID, NCBI GeneID, and synonyms) and functional (product function, GO terms, and COGs) information on the gene along with their in-degree, out-degree and clustering coefficient, and an interactive network panel displaying the gene and their graph neighborhood (see Interactive network panel). Here the canonical gene name cross-links to specialized databases containing genomic and molecular details.
By following the modules link in the regulatory network models listing, the users get a list of all the modules identified in that regulatory network model. Data displayed in that list comprise the number of genes belonging to that system, the enriched GO terms and their q-value, and a module ID linking to another section displaying the system in an interactive network panel and listing the genes belonging to the system along with their product descriptions.
Search by gene
An interface to search Abasy Atlas is also available in the top menu bar of every section. Users may search a gene in all the regulatory network models (by default) or in a subset by selecting the proper option in a searchable dropdown list allowing multiple selections. Search using this interface is case-insensitive and the user may employ wildcards in the search string. Supported wildcards are ‘?’ to match any single character and ‘*’ to match any arbitrary number of characters including zero.
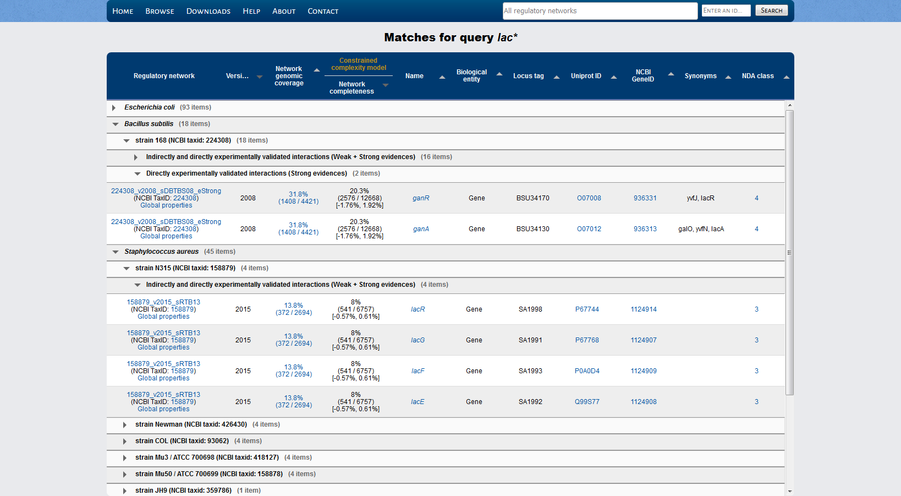
The search engine looks for the query in the set of canonical gene names, synonyms and locus tags returning a composite set of results grouped for each regulatory network model and ordered by canonical gene name (Figure 1). The results section lists all the matches found providing canonical gene names, locus tags, UniProt IDs, NCBI GeneIDs, synonyms, and classes of system-level elements according the NDA. Gene names link to the details section described above. If the class of system-level elements is a system, this links to the corresponding entry in the list of all the modules identified in that regulatory network model.
Figure 1. Querying Abasy Atlas using the string "lac*".
Interactive network panel
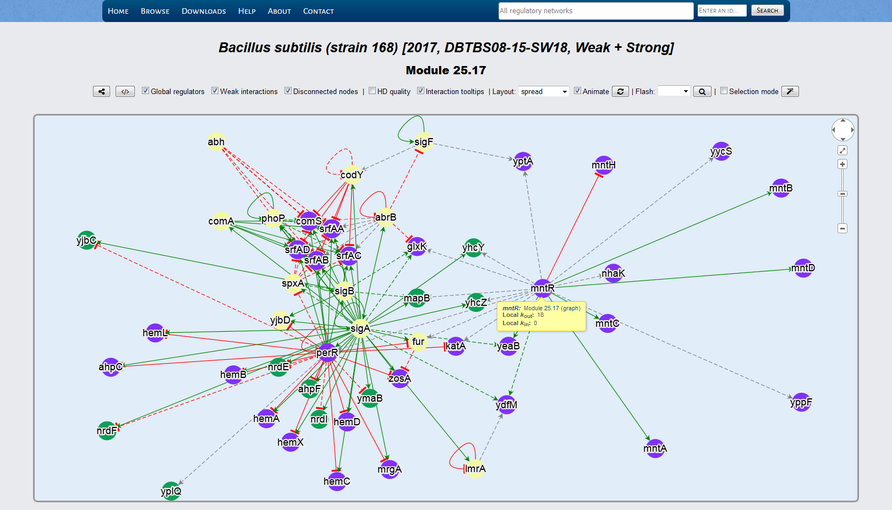
Abasy Atlas displays whole modules and the closed neighborhood of genes (i.e., the set of all the genes/complexes regulating or being regulated by a given gene, including the latter) in interactive network panels that share a common interface (Figure 2). This interface provides a share button () to download the displayed network as image in PNG format with transparency, which is free for use in papers and other academic/non-commercial uses as long as proper citation to Abasy Atlas is provided. A button () allows to download the displayed network in JSON format, which is importable into Cytoscape.
It is also possible to remove global regulators, disconnected nodes, and weakly supported interactions temporally. Interaction tooltips can be disabled by using the corresponding checkbox. A dropdown list enables the user to apply a layout to the network, and a button () reapplies the selected layout. A checkbox controls whether layout transitions are animated or not, this is a useful control when the number of nodes could slow the web browser. The HD quality checkbox controls whether high quality animations are used during network manipulation and animated layout transitions. The HD quality animation is off by default, and we suggest this for improved responsiveness of the browser.
A dropdown list enables to select a gene that will be flashed to facilitate its identification, and a button () reflash the selected gene. Nodes can be selected by enabling the selection mode through the corresponding checkbox. A red border identifies selected nodes. Selected nodes can be dragged together by the user, and they are treated specially, moving they together, by the layout algorithm. A button () deselects all nodes. The configuration of all the checkboxes and selected layout is preserved across a session in the same web browser tab. When the user closes the tab, the configurations are restored to default.
All the nodes can be dragged around and repositioned, and clicking on an interaction switches its state between normal and highlighted. If the mouse hovers over a node or interaction, a tooltip displays providing information such as local (neighborhood dependent) out- and in-degrees, subunits if the node is a regulatory complex, and links to other genes and modules. The user also may explore the regulatory network model by graphical browsing. If the user clicks in a node, he is redirected to the details section of the corresponding gene.
We fine-tuned the parameters for rendering the network in order to optimize responsiveness and user experience. Besides, we developed an adaptive layer running on top of the algorithms rendering the network. Before a network is rendered, this adaptive layer assesses the performance of the user’s computer and, if necessary, overrides user’s selections for a smoother experience. If the adaptive layer found that the user’s computer will exhibit degraded performance for a particular network, then layout animation is disabled and the network is always initially displayed using the grid layout despite previous user selections. The user can always re-enable layout animation or change the layout upon accepting a warning regarding the risk of degraded performance.
In the upper-right corner of the network panel, a widget similar to that used by Google Maps is available. This widget enables panning and zooming the network. The user may also use the mouse wheel for zooming the network. Inside the interactive panel, the network is displayed by using a color code for nodes and interactions. We encoded interaction effects in line colors and arrowhead shapes as follows: red and T shape for repressions, green and arrow shape for activations, orange and diamond shape for dual, and grey and arrow shape for unknown effect. Evidences supporting interactions, when available, are encoded as different line styles: solid for strong evidences and dashed for weak evidences. Genes belonging to the same system or class of system-level element have the same color. In the gene details section, the central gene is highlighted in yellow. If the central gene product is a subunit shared by several complexes, all these complexes are also highlighted. We represented heteromeric regulatory complexes as pentagons, whereas genes are circular nodes.
Figure 2. Interactive network panel for module 25.17 of one of our meta-curations of B. subtilis 168.