Abasy Atlas provides a comprehensive atlas of annotated functional systems (hereinafter also referred as modules), global network properties, and system-level elements predicted by the natural decomposition approach[1,2,3,4] (NDA) for reconstructed and meta-curated regulatory networks across a large range of bacteria, including pathogenic and biotechnologically relevant organisms. Regulatory networks could be thought of as a “take decisions” organ in bacteria. They not only sense stimulus and respond accordingly but, for example, in a complex environment, they “take composite decisions” to prioritize the assimilation and catabolism of carbon sources according to the metabolic preferences of each organism. To accomplish this, RNs composed by thousands of regulatory interactions, must follow well-defined organization principles governing their dynamics.
In the last decades of the 20th century, the first levels of gene organization were unveiled as the operon and the regulon[2]. Currently, a few databases (e.g., RegulonDB, SubtiWiki, DBTBS, CoryneRegNet, and RegTransBase) extract, by manual curation of literature, the molecular knowledge about gene regulation in different organisms providing an invaluable source of information. Nevertheless, information on these databases never goes beyond the regulon level, whereas cumulative evidence has showed that regulatory networks are complex hierarchical-modular networks whose organizational and evolutionary principles are pivotal for determining the dynamics of the cell and still challenging our understanding. In this atlas, we take the first step towards a global understanding of the regulatory networks organization by building a cartography of the functional architecture for each of the best-studied organisms.
Citation policy
If you want to reference Abasy Atlas, the provided data or any generated image, please cite the latest version 2.2:
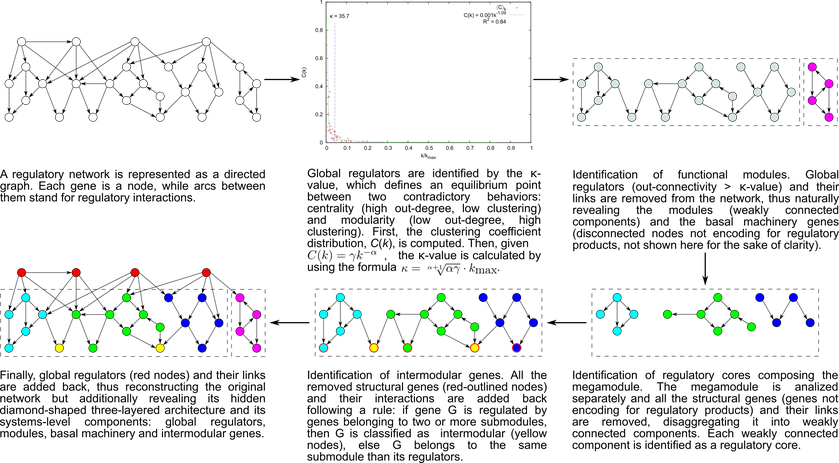
The NDA defines criteria to identify systems and system-level elements in a regulatory network, and rules to reveal its functional architecture by controlled decomposition (Figure 1). This biologically motivated approach mathematically derives the architecture and system-level elements from the global structural properties of a given regulatory network. It is based on two biological premises[1,2]:
A module is a set of genes cooperating to carry out a particular physiological function, thus conferring different phenotypic traits to the cell.
Given the pleiotropic effect of global regulators, they must not belong to modules but rather coordinate them in response to general-interest environmental cues.
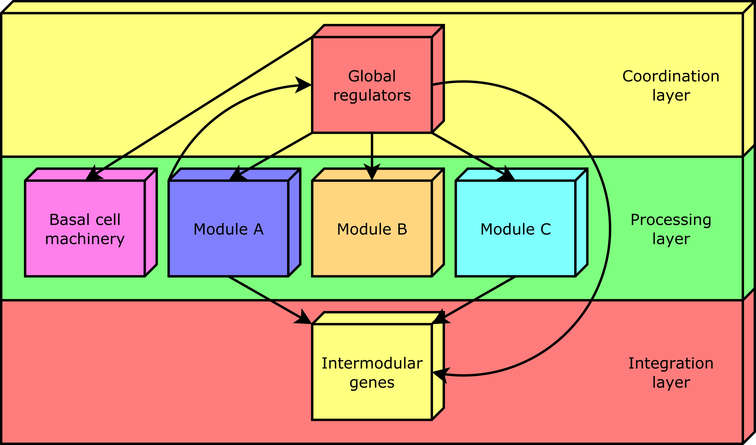
According to this approach, every gene in a regulatory network is predicted to belong to one out of four possible classes of system-level elements, which interrelate in a non-pyramidal, three-tier, hierarchy shaping the functional architecture as follows[1,2,3,4]: (1) Global regulators are responsible for coordinating both the (2) basal cell machinery, composed of exclusively globally regulated genes (EGRGs), and (3) locally autonomous modules (shaped by modular genes), whereas (4) intermodular genes integrate, at promoter level, physiologically disparate module responses eliciting a combinatorial processing of environmental cues (Figure 2).
There are a couple of advantages resulting from developing an ad-hoc method based on biological knowledge: (1) Global regulators (hubs) does not belong to any module. This is biologically important because they are not related to a particular physiologic function. (2) We identify that there are overlap among modules and it is mediated by the intermodular genes. None of this key features existing in bacterial regulatory networks could be identified with any of the methods commonly used to identify communities in complex networks.
Figure 1. The natural decomposition approach. Figure 2. The functional architecture unveiled by the NDA is a diamond-shaped, three-tier hierarchy, exhibiting some feedback between processing and coordination layers, which is shaped by four classes of system-level elements: global regulators, locally autonomous modules, basal machinery, and intermodular genes.
Estimating regulatory networks completeness by leveraging their constrained complexity
The ability to quantify the total number of interactions in the complete GRN of an organism is a valuable insight that will leverage the daunting task of curation, prediction, and validation by enabling the inclusion of prior information about the network structure. Besides, the ability to track the completeness, quantified as the fraction of the known interactions from the total number in the complete network (interaction coverage), through different historical snapshots could allow to develop models on how new regulatory interactions are discovered, and to provide a framework to assess network analysis and network inference tools. But poor efforts have been directed towards the longstanding problem of how to assess the completeness of these networks. Traditionally, genomic coverage has been used as a proxy of completeness. The genomic coverage of a regulatory network is the fraction of genes in the network relative to the genome size. Nevertheless, this measure poses potential biases as it neglects regulatory redundancy and the combinatorial nature of gene regulation, thus potentially overestimating network completeness.
For example, the addition of a global regulon or sigmulon (perhaps discovered by high-throughput methodologies) to a quite incomplete regulatory network could bias the genomic coverage. Assume you have a regulatory network with a genomic coverage of 15% (600 / 4000) and 700 interactions. You then found a paper reporting the promoter mapping for the corresponding housekeeping sigma factor, whose sigmulon have 3000 genes (400 of which were already in the original network). Next, you found that 100 out of the 3000 interactions in the global sigmulon already exist in our original network. You then integrate all the remaining 2900 new interactions to your original network to found that your resulting network have a new genomic coverage of 80% (3200 / 4000) and 3600 interactions. This new high genomic coverage may suggest a highly complete network but in fact it is the same quite incomplete original network plus a single global sigmulon. To clarify this, assume that the total number of interactions in the complete network is 10000, then the completeness of this new network is 36% (3600 / 10000). Whereas the curation of a single housekeeping sigmulon increased the completeness ∼30% (3600 / 10000 - 700 / 10000), the new completeness is still low, and the genomic coverage is highly overestimating when is used as a proxy for completeness. Therefore, to correctly state the completeness of a regulatory network, it is fundamental to estimate the total number of interactions.
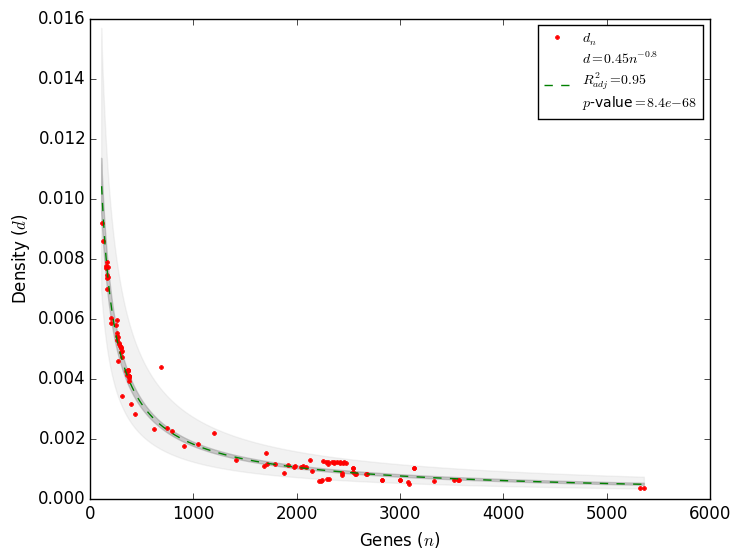
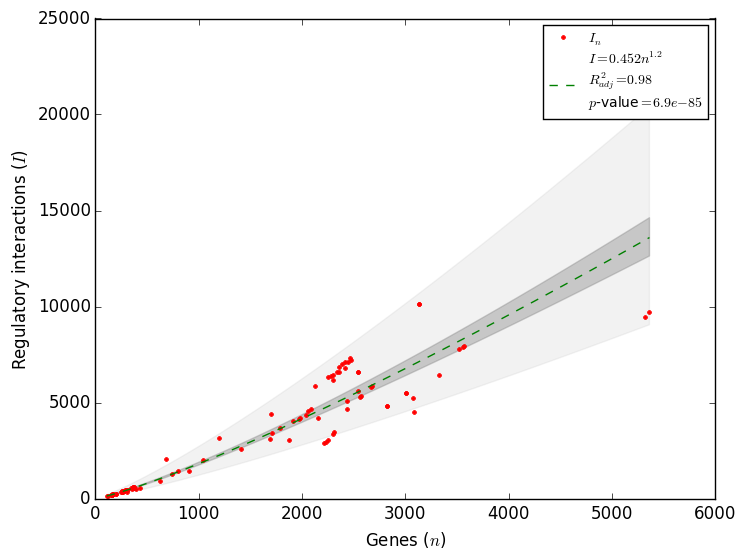
Therefore, to correctly quantify the completeness of a regulatory network the total number of regulatory interactions is required. A recently found constrain in the complexity of regulatory networks allowed to estimate the total number of interactions a regulatory network has[5]. Using all the regulatory networks available in Abasy Atlas, it was found that the density as function of the number of genes follows a power law as d ∼ n-α with α ≈ 1 (Figure 3), which is in agreement with the May-Wigner stability theorem. Network density is the fraction of potential interactions that are real interactions, thus a constraint in network density implies a constraint in the total number of interactions. Motivated for this finding, we reformulated the problem to found that the number of interactions also follows a power law as I ∼ nγ with γ = 2 - α (Figure 4). This power law may be used to compute the total number of interactions (Itotal) in the regulatory network of an organism as Itotal ∼ (genome size)2 - α. This model has a better fit to data than the previous three models[5]. We implemented this model in Abasy Atlas to provide estimations on the completeness of each regulatory network, including confidence intervals. This model is able to learn the tendency in the number of interactions, and it therefore improves as more regulatory networks are included in Abasy Atlas.
Figure 3. Complexity is constrained in regulatory networks[5]. Figure 4. The constrained complexity of regulatory networks allows to compute the total number of interactions.
Luis G. Treviño-Quintanilla, PhD (Upemor) (former contributor)
Funding
The development of Abasy Atlas has been supported by grants IN201224, IN202421, IN205918, IA200616 and IA200614 from PAPIIT-UNAM to Julio A. Freyre-González.